Introduction
“Citizen science” represents the involvement of the public in various stages of scientific investigations – the development of the study, the collection of data and/or the interpretation of the results1. The main purpose of citizen science programs is to bring the public closer to science2. Such programs generally lead to the democratization of science and environment by sharing information and expertise between researchers and the public3. The development of technology in recent decades has significantly facilitated the public engagement in science programs. The online environment (mobile apps, web platforms, social networks) is an effective way to connect with volunteers, supervise activities, communicate results and provide support4. Citizen science programs can easily be promoted and disseminated through social networks, reaching more volunteers than before5–8. In Romania, approximately 10 million people use at least one social media platform9 and most of them access it from their mobile phones10. The advantage of these approaches for promotion and data collection is that they are free and allow the involvement of a large number of participants. For publicly collected data, the optimal strategy is to start with a simple set of data and requirements to encourage participants and increase their confidence to contribute to scientific applications. Engaging them in activities that require elaborate training could overwhelm them, leading to early project abandonment.
Methodology
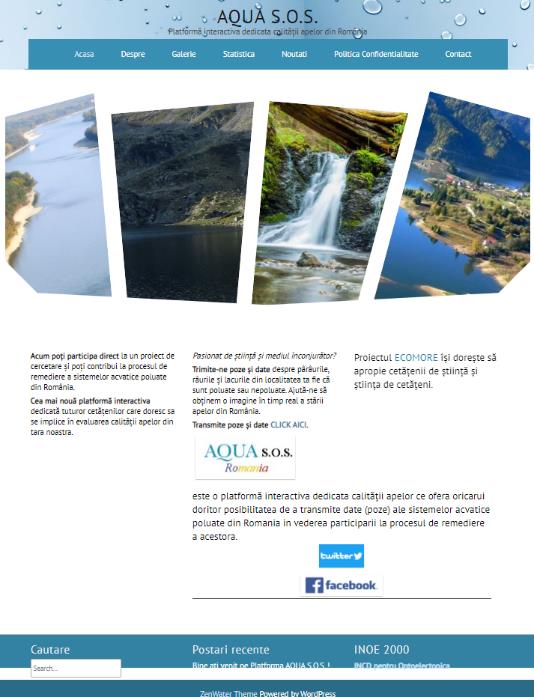
The concept behind the online platform Aqua S.O.S. was based on the preexisting citizen science platforms and applications. In this regard, the Freshwater Watch 11, EarthEcho 12 and Clean Danube! platforms13 served as models for the structure of the website and the amount of information provided. An attractive but, at the same time, simple structure was chosen for easy access from mobile devices (https://aquasos.inoe.ro/) (Fig. 1a). Also, the information was provided in a friendly manner, with short messages, but also with a link to the ECOMORE website so that participants can access details about the project’s objectives and activities. The platform was created in WordPress and hosted for free on the inoe.ro domain. WordPress helps for the easy and free development of web pages, and the inoe.ro domain ensures the long-term development of the activity.
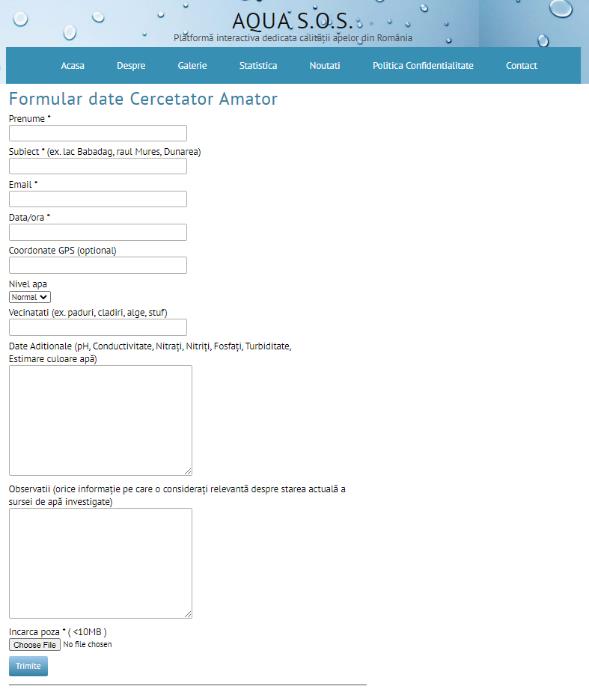
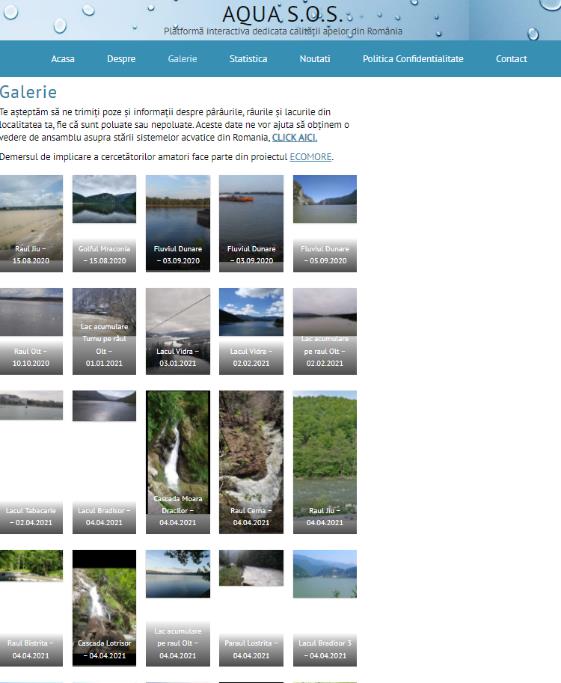
The data submission form opens in a separate page (Fig. 1b). A compromise was chosen between the time required to complete the form and the type and amount of information requested. Previous studies have shown that most participants only contribute with information that can be easily obtained14 or that does not require much documentation2. Thus, certain information was required in the online form, without which the submit data button did not work : participant’s first name, subject (for example, Babadag Lake, Mureș River, Danube River), email address, date/time and a photo (max. 10 MB). Optional fields included: GPS coordinates, water level, neighborhoods, additional data (water quality parameters), observations. The GPS coordinates were optional because other studies have observed that in most cases the GPS data entered by the public is erroneous15. Most likely, participants are not calibrating their mobile phones or properly setting all the necessary functions for location identification. The field for additional data has been included for volunteers who wish to contribute with water quality analyses. The completed form, at least with the mandatory fields, was sent to the email address of the project coordinator for verification of the information sent. The participants’ contributions are displayed as a gallery on the online platform, and a click on each picture displays the details submitted by the participants about the evaluated aquatic systems (Fig 1c). Existing platforms 11–13 display the data on an interactive map. In the Aqua S.O.S. situation, it was decided to include the data in the gallery, because the inclusion of a map requires more extensive knowledge of web design, and the Aqua S.O.S activity must be carried out in the long term without the need for the involvement of specialized personnel.
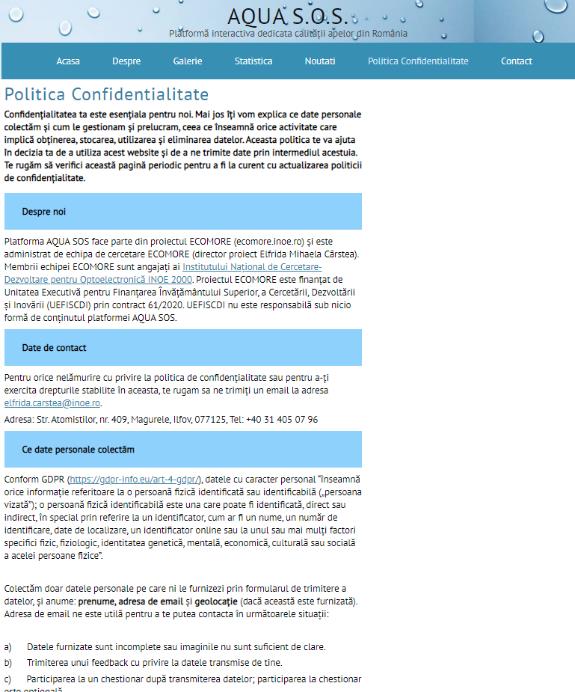
Particular attention has been directed towards the security of data submitted by participants. According to the 10 principles stipulated by the European Association of Citizen Science16, regarding the organization and implementation of projects with public involvement in scientific activities, the coordinators of these projects must consider legal and ethical issues related to shared data and confidentiality. Thus, in the data submission form, only the first name and email address are requested. Only the participant’s first name is displayed in the public space, the email address being confidential and known only to the project coordinator. Based on the same principles, GPS coordinates are optional, the participant being able to choose if they want to share this information. The privacy policy is presented on the web page of Aqua S.O.S. (Fig. 1d). Before launch, the platform was tested by members of the research team.
Fig. 1 Print screen on the Aqua S.O.S. web page https://aquasos.inoe.ro/: a) home page; b) data submission form; c) gallery; d) confidentiality agreement.
Promotion
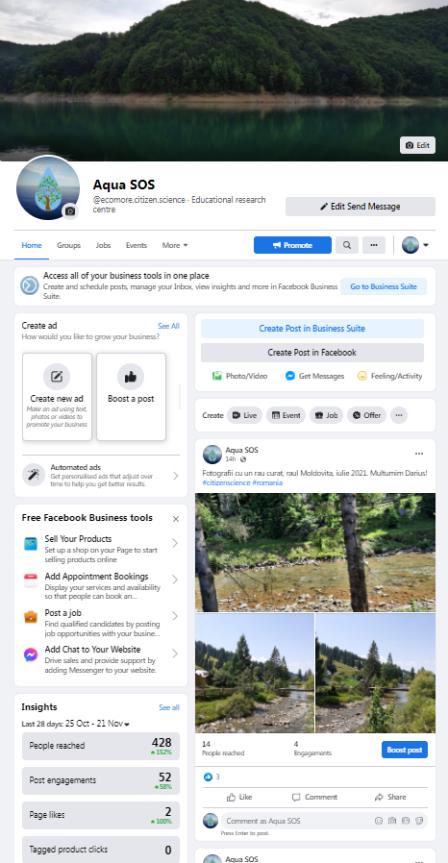
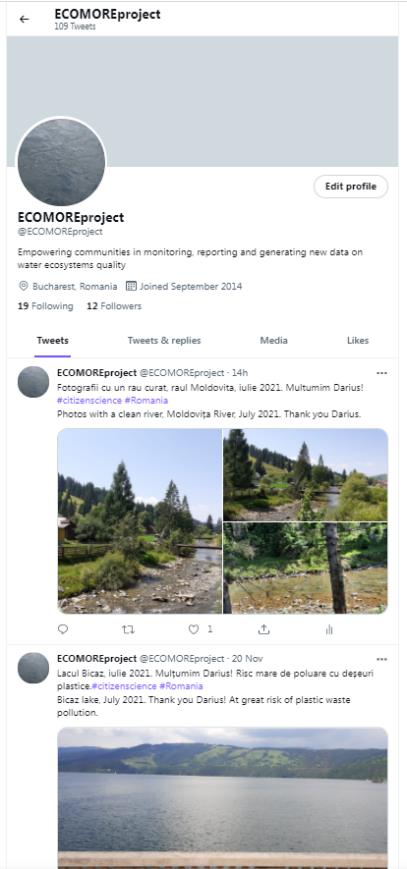
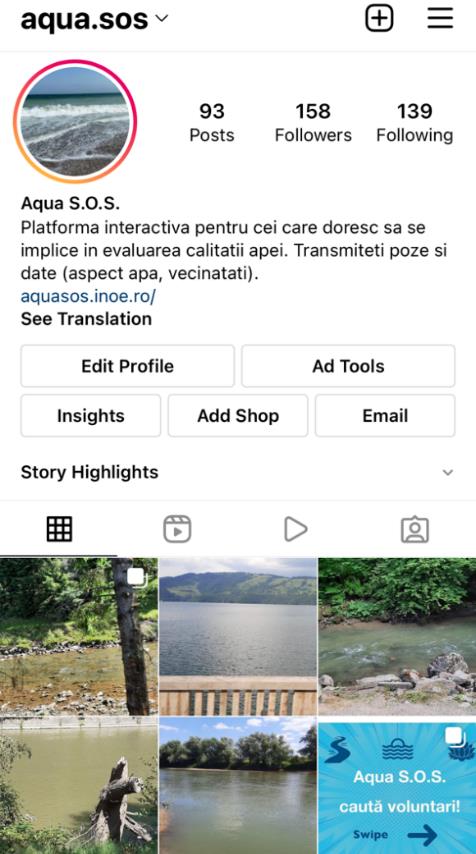
To promote the Aqua S.O.S platform, individual pages were created on the main social networks: Facebook, Instagram and Twitter (Fig. 2). At the same time, social media accounts helped to recognize the contribution of participants. Each photo was posted on these accounts with a brief description of the overall condition of the aquatic system under review, and participants who follow the Aqua S.O.S. can view and redistribute their contributions on their personal pages. The platform was also promoted on the professional network LinkedIn. Since a real social media impact is built over a long period of time, the platform was also promoted on messaging apps (WhatsApp and Signal). These methods of promotion have been applied in the past, in citizen science projects, and are based on the idea of ”snowball sampling” through which the public can pass on the information viewed and thus, the information reaches as many people as possible4-6. Social media also helps to strengthen the relationship between researchers and the public and to reach the target audience4.
The announcement of the launch of the platform was posted a few days before the Easter break so that participants could allocate the necessary time to engage in the activity. Also, the objective was for the information to remain fresh in the memory of the participants during the vacation. Given their level of attention on social media posts (2.5 sec on Facebook, under 10 hours on Twitter) and the amount of information available on personal pages17, the ad was at risk of getting lost in the large volume of data. The ad was reposted, notably on Facebook, and picked up by the press. Thus, the platform was presented on the show “E vremea ta (It’s your time)!”, from TVR2, on May 1, 2021 (Fig. 3).
Fig. 2 Individual social media accounts: Facebook, Twitter and Instagram..

Fig. 3 Print screen with the presentation of the Aqua S.O.S. platform on the show “E vremea ta! (It’s your time!)”.
Also, the platform was presented on Radio Romania Cultural shows: Știința 360 (Science 360) – 12 May 2021 (https://www.radioromaniacultural.ro/stiinta-360-12-mai-2021-ecomore-proiectul-care-ne-invata-citizen-science/) and Born in Romania – May 15, 2021 (https://www.radioromaniacultural.ro/nascut-in-romania-oamenii-de-stiinta-si-au-dat-seama-ca-nu-pot-sa-faca-absolut-orice-fel-de-cercetare-fara-ajutorul-publicului-sambata-15-mai-2021/). During these shows, it was possible to discuss in detail what citizen science means and the level at which the field is at the national level, in order to give the public an image of the concept of citizen science in particular and research in general.
Moreover, the Aqua S.O.S. and the activities of the ECOMORE project were promoted on the UEFISCDI website, in the news section (https://uefiscdi.gov.ro/news-proiectul-ecomore?fbclid=IwAR0Org1r0TkItdIqyzHlHFTmh_8AmXldDCTadH5tqLfBUiYI_n8k65u_enk) and on the Facebook profile of the Open Science Knowledge Hub RO, administered by UEFISCDI.
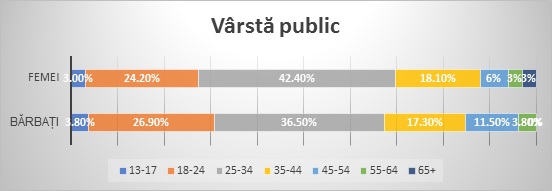
Rețelele de socializare, în special Twitter și Instagram, au permis evaluarea facilă a impactului și a gradului de receptivitate în ceea ce privește conținutul postat. De asemenea, a ajutat la înțelegerea publicului care urmărește conținutul și a nivelului de implicare. Un exemplu este prezentat în Figura 4, cu impactul postărilor pe Twitter în perioada 24 august – 22 noiembrie 2021. S-a observat că impactul este relativ redus, în 91 zile înregistrându-se un grad maxim de implicare de 11 % (like/retweet), deși postările au adunat 1200 de impresii. Comparativ cu celelalte platforme de socializare, Twitter are un impact mediu. Conform statisticilor oferite de aceste rețele, postările pe Instagram par să prezinte un grad mai mare de receptivitate a publicului, dar nu s-a primit nicio contribuție pe această platformă. Facebook pare să aibă un impact aproape nul. Însă, aici s-a realizat contactul cu presa și s-au recrutat o parte din voluntarii ce vor fi incluși în etapa următoare a proiectului. Pe de altă parte, statistica oferită de Instagram a ajutat la evaluarea provenienței și categoriilor de vârstă ale publicului implicat. Astfel, s-a observat că o mare parte din cei care urmăresc pagina Aqua S.O.S. de pe Instagram provin din mediul urban, 25 % fiind din București, iar 17 % din Brașov, Cluj-Napoca, Iași și Timișoara (Fig. 5a). Aproape 61 % din publicul abonat la contul de Instagram este format din bărbați, însă publicul feminin este în creștere. Categoria principală de vârstă este reprezentată de cei între 25-34 ani, urmată de 18-24 ani și 35-44 ani. Doar 3 % din public are peste 65 ani, ceea ce înseamnă că este foarte puțin probabil ca anunțurile pe rețelele de socializare să ajungă la publicul senior. De asemenea, nu se cunoaște receptivitatea la nivel rural sau în zone defavorizate. Totuși, observațiile de până acum, legate de publicul interesat de acțiunile citizen science corespund studiilor anterioare 18.
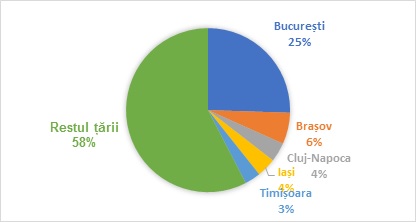
Social media networks, especially Twitter and Instagram, have made it easy to gauge the impact and responsiveness of posted content. It also helped to understand the audience watching the content and the level of engagement. An example is presented in Figure 4, with the impact of posts on Twitter between August 24 and November 22, 2021. It was observed that the impact was relatively low, in 91 days registering a maximum degree of engagement of 11% (like/retweet), although the posts gathered 1200 impressions. Compared to other social media platforms, Twitter has a medium impact. According to the statistics provided by these networks, posts on Instagram seem to show a higher degree of responsiveness from the audience, but no contribution was received on this platform. Facebook seems to have almost zero impact. However, here the contact with the press was made and some of the volunteers who were included in the following stage of the project were recruited. On the other hand, the statistics provided by Instagram helped to evaluate the origin and age categories of the audience involved. Thus, it has been observed that a large part of those who follow Aqua S.O.S. on Instagram come from the urban environment, 25% being from Bucharest, and 17% from Brașov, Cluj-Napoca, Iași and Timișoara (Fig. 5a). Almost 61% of the audience subscribed to the Instagram account is male, but the female audience is growing. The main age category is represented by those between 25-34 years, followed by 18-24 years and 35-44 years. Only 3% of the audience is over 65, meaning that social media ads are highly unlikely to reach the senior audiences. Also, the receptivity in rural areas or disadvantaged areas is not known. However, the observations so far related to the public interested in citizen science actions correspond to previous studies18.
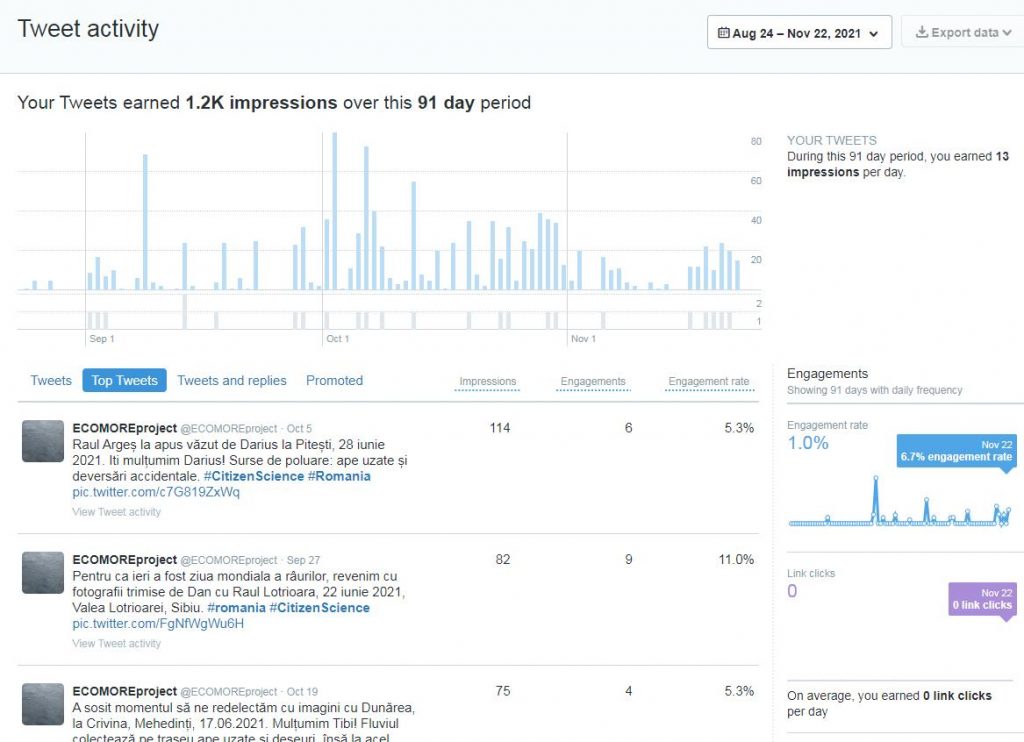
Fig.4 Print screen with the impact and engagement of the audience following Twitter posts.
Fig. 5 Statistics of the audience following Aqua S.O.S page on Instagram. a) Geographical distribution; b) age categories.
Results
Participants
Between April and November 2021, 109 contributions were received from 24 participants. We received current photos as well as photos made in the years before the campaign. We have included in the database only photos taken since August 15, 2020, but only 11 contributions represented photos taken by participants before April 2021. All data, except for participants’ email addresses, are presented in the table attached to this report . Although the announcement sent on messaging apps (WhatsApp and Signal) contained the link to the Aqua S.O.S. platform, most of those who sent photos preferred to use these apps. In fact, if we analyze the ways of sending information preferred by the participants, it can be seen that more than half were sent through messaging applications (Fig. 6). Messaging apps provide an easy way for the public to transmit photos, and this preference should be considered in future citizen science actions. However, this way does not facilitate the process of receiving detailed data from participants about the respective aquatic systems, as an online form could. Messaging apps are indicated in studies where only one piece of information is requested. For example, Weeser et al.18 posted a phone number and project information on billboards near public bridges for interested passersby to text the water level and station number. However, the use of multiple data transmission channels favors access to a wider audience, even if the amount of detail received is reduced. In a study by the municipality of Rotterdam, Netherlands, to determine critical rainfall levels and flood occurrence, data was received from the public via phone, smartphone apps, email and web page, but with poor temporal resolution and with few details19. Fehri et al.20 only used an online platform to obtain rainfall data from the public. But the platform could easily be used only by the young audience, senior participants needing more training. According to Longo et al.4 young audiences prefer mobile applications. This approach was not applied in the current action for logistical reasons, an online platform being easier to maintain in the long term than a mobile application that requires constant updates. We assume that promoting on social networks will manage to some extent to reach the widest possible audience by categories of age, location and data transmission preferences. Facebook, for example, is the most accessed social media platform in Romania, and 61% of the online population between the ages of 16 and 74 are daily users21.

Fig. 6 The ways in which data were received from participants.
Most of the contributions were received in May 2021, and in the months of April, June, July and August there was a lower volume of contributions, equally distributed between the months considered. Figure 7 shows the monthly distribution of contributions received, from which we removed the 11 records dated before April 2021. The number of records dropped dramatically with the onset of wave 4 of the COVID-19 pandemic and the imposition of travel restrictions. Thus, there was a risk that participants would lose interest in the Aqua S.O.S. platform, as observed in other public engagement actions2, especially considering the limited number of actions of this kind in Romania. We hope to be able to provide long-term support by continuing to promote Aqua S.O.S.. Also, by establishing a dedicated group of volunteers, we were be able to compensate for the lack of contributions during this period. Additionally, we asked past participants to seasonally submit photos and information of aquatic systems in their areas of residence.

Fig. 7 Monthly distribution of contributions received from participants (excluding data collected before April 2021).
Previous studies2,18 have shown that a small group of participants is sufficient for a successful citizen science action, if they show sufficient motivation and passion towards the project’s objectives. For example, Weeser et al.18 received contributions from 124 participants, but only 13 participants were more active, contributing with 83% of all data received. Also, in the study by Scott and Frost22 where volunteers were asked to measure water quality parameters and to collect samples that were sent to a research laboratory, only 30% of participants collected samples and only 17% collected from multiple locations. In the present study, out of the 24 participants, 6 participants contributed with 72% of the total images, and 12 participants submitted only one image. Active participants are mainly interested in the project goals and the general quality of the environment they inhabit, or are passionate about nature and travel. In the next stage, a questionnaire was sent to all participants in order to understand the motivation to participate in citizen science actions, as well as the level of knowledge and education about environmental issues.
Contributions of participants
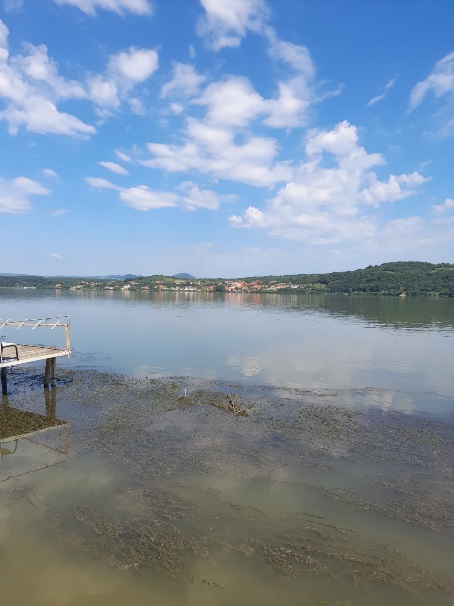
Statistical analysis in the received data contribution is presented in Figure 8. The majority of contributions were received with aquatic systems from the counties of Vâlcea, Argeș and Arad, followed by Gorj, Mehedinți, Hunedoara and Prahova. Photos and data were received for 75 aquatic systems including: 34 rivers, 22 lakes, 5 streams, 5 canals, 5 waterfalls, 2 ponds, the Danube River and the Black Sea (see Annex). The photographed aquatic systems are mainly located either near the participants’ residences or on the route of important tourist attractions. The most photographed aquatic systems are considered by themselves tourist attractions. The Danube River (including Mraconia Bay and the Danube Delta) had the most contributions, followed by the Olt River and its reservoirs (Fig. 9). Only one contribution was received with the Black Sea, although it is an important tourist attraction. The explanation is probably related to the large number of tourists, which makes it almost impossible to take photos without the presence of other people in the frame.

Fig. 8 The distribution by county of the contributions received by Aqua S.O.S. platform
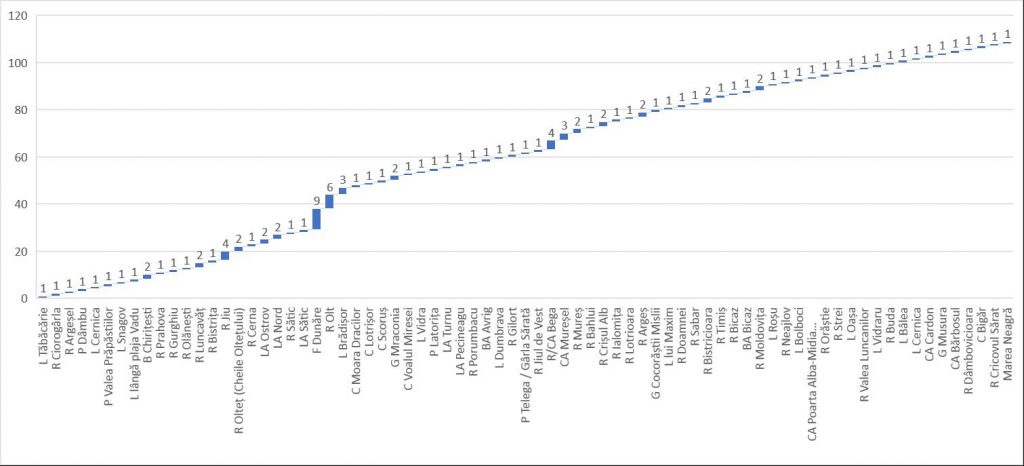
Fig. 9 Number of contributions for each aquatic system registered. The abscissa shows a selection of the evaluated aquatic systems.
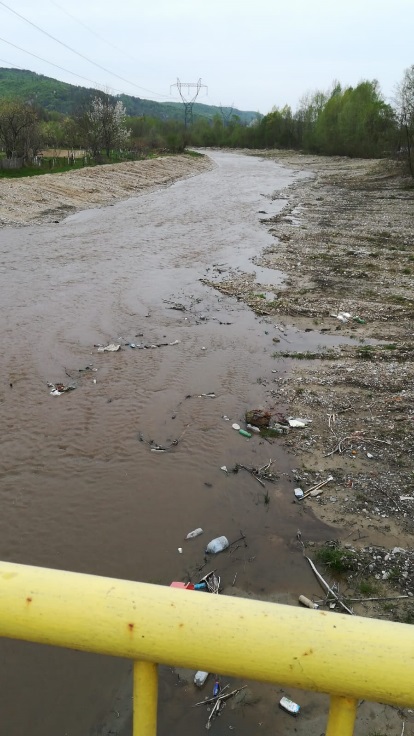
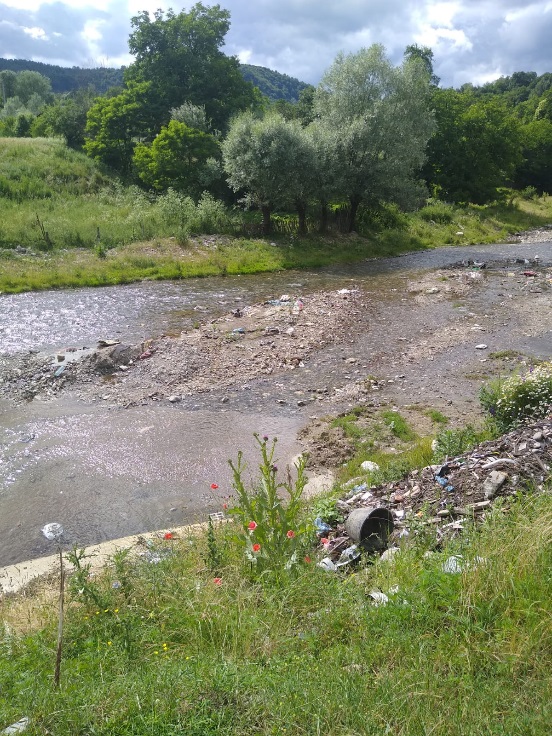
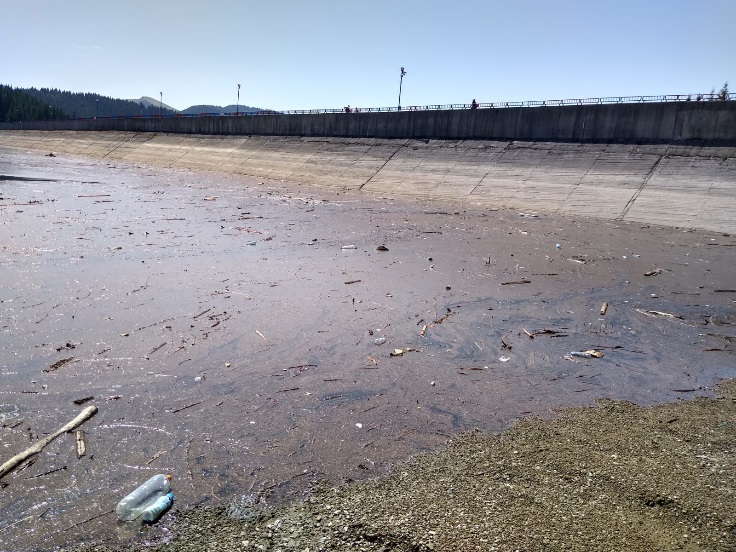
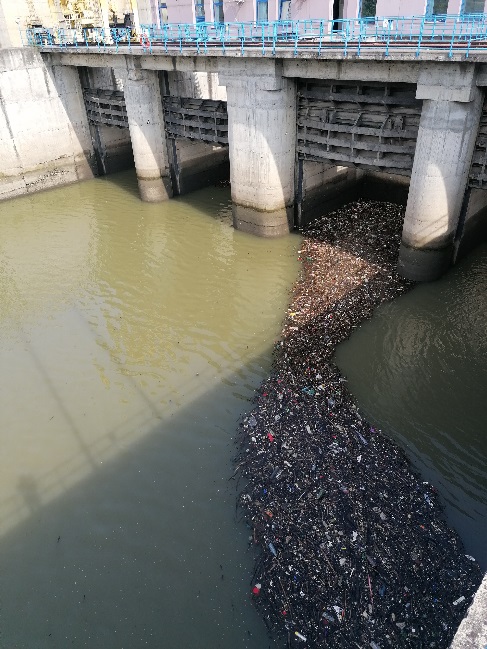
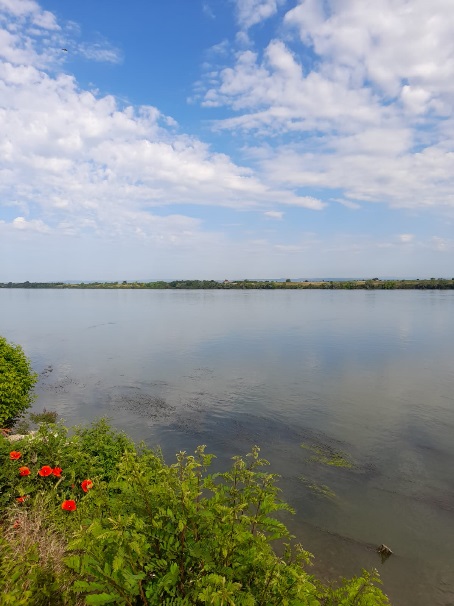
After analyzing the photos and data sent by the participants, it was observed that most aquatic systems have an apparently clean appearance (i.e. no pollution on the water surface): 58 out of the total of 75 evaluated systems (Fig. 10). Some aquatic systems, although characterized by a clean appearance, had some waste on the banks of the waters (for example, Rivers Gurghiu, Jiu (at Lainici), Cricovul Sărat, or Lacul lui Maxim and the Oașa Lake). In fact, waste is the biggest problem visible in the photos submitted by the participants. Approximately 30% of the aquatic systems included in the study present waste on the surface or on the banks of the waters (Fig. 10). Some examples, with the Argeșel, Bega and Bistricioara Rivers and the Bolboci Lake, are presented in Figure 11. Waste does not only affect the aesthetics of the area, but can pollute the entire ecosystem, depending on its type and quantity. Plant and construction waste (for example, Bistricioara River and Bolboci Lake – Fig. 11c and d) can release organic matter (dissolved and particulate) that influences the biogeochemical processes of aquatic systems. Plastic waste can affect water quality in the long term due to poor degradation in the environment. At least 64% of the waters reported with waste were observed to contain at least one plastic object. In the case of 8 aquatic systems, for which the presence of waste was recorded, we could not determine with certainty the type of waste due to the low resolution of the phone’s camera, but we cannot rule out the possibility that plastic was present among the waste. The negative effects of plastic on the aquatic environment are multiple and depend on its type and size23. Plastic can be ingested by animals, affecting their behavior, reproduction and development. Plastic can also break down into smaller and smaller fragments, down to the nanometer level, under the action of UV radiation and mechanical forces, and can end up in food or drinking water. However, the degradation process of plastic in nature is relatively slow, and the risk of plastic particles rapidly accumulating in water and sediments is quite low23. On the other hand, plastic can quickly release toxic additives that accumulate in the ecosystem23. Furthermore, plastic waste in rivers and lakes can affect the economy and the lifestyle of the population, by increasing the risk of flooding, damaging ships or reducing tourism in the affected areas23. The most common types of plastic seen in the submitted images are PET containers, food packaging and bags. This observation confirms previous studies24. Most types of plastic waste were observed in the Olt River (Fig 11e), probably transported along the entire basin to the point of analysis. However, the observation sent by the participant indicates the degree of waste pollution only at one point and on one day. We have no information about the frequency of waste pollution events, about their extent, nor whether measures are taken by the authorities.

Fig. 10 Assessment of the degree of pollution of aquatic systems based on the information provided by the participants.
Fig. 11 Photos of waste pollluted waters: a) Argeșel River, Hirtiești, Argeș (May 1, 2021); b) Bega River, Timișoara (June 10, 2021); c) Bistricioara River, Romanii de Sus, Vâlcea (July 3, 2021); d) Bolboci Lake, Dâmbovița (July 29, 2021); e) Olt River, Racovița, Vâlcea (May 27,2021).
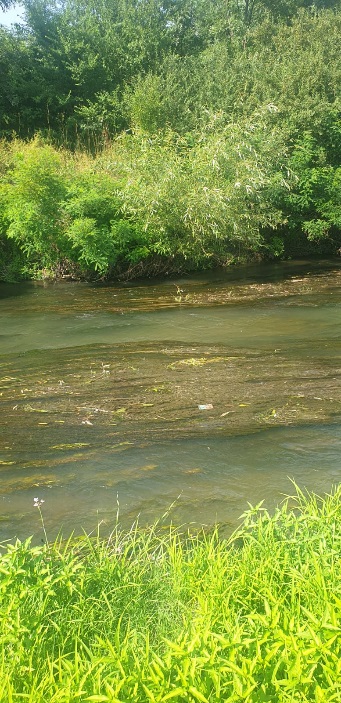
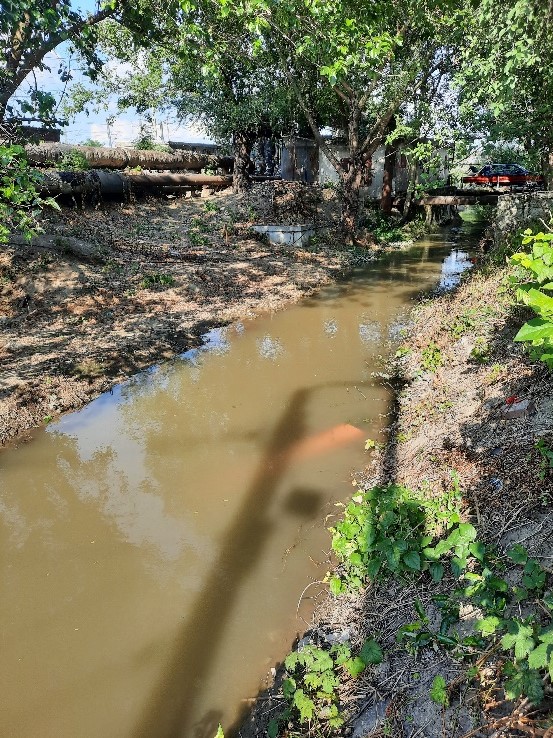
Among the most aggressive forms of pollution of aquatic systems are contamination from agricultural sources and the discharge of sewage, especially untreated. Visual assessment of the degree of pollution is often difficult or even impossible. In cases of extreme pollution, changes in the color and transparency of the water, dead fish on the surface, as well as the lack or abundance of algae and some species of aquatic plants can be observed. Water color was reported by only one participant for the Mureșel Channel (Appendix). Water transparency was reported in three cases (Dâmbu Stream, Valea Prăpăstiilor Stream and Timiș River). Algal presence or abundance were not reported in any of the cases. Instead, the abundance of aquatic plants was reported in the case of the Cardon and Bărbosul Channels, in the Danube Delta. In some photos (for example, the case of the Strei River) the excessive presence of underwater plants could be observed, but their species could not be identified. In the case of aquatic systems for which participants provided detailed images (those sent via messaging applications) the dominant species could be identified. Excessive abundance of aquatic plants indicates the presence of a large amount of nutrients, and a lack of aquatic plants may indicate sewage pollution. Certain underwater plant species can serve as bioindicators of water quality. For example, Potamogeton pectinatus is associated with a high degree of eutrophication25 and was observed in the photographs of the Neajlov River, and Potamogeton perfoliatus, associated with mesotrophic waters25 was observed on the banks of the Danube, near the towns of Crivina and Ostrovul Corbului (Fig. 12). However, in situ investigation of plant species and correlation of their presence with other water quality parameters is needed. Another important aspect that can help identify sewage pollution is the smell of the water, but this aspect was also not reported. It is important to note that participants were only given some cues about what to report and were given no instructions.
In the case of the Crișul Alb and Timiș Rivers, agricultural crops were reported in the vicinity. The proximity to parks was also reported for the Bega Channel and the Mureș River. Contamination of waters with pesticides is possible from both agricultural practices and green space management. Although data on these aquatic systems are not known, our previous studies26,27 have shown that organochlorine pesticide pollution persists in sediments and is resuspended to the water surface, even decades after the banning of these pesticides. Also, these aquatic systems run the risk of collecting rainwater loaded with nutrients from fertilizers, which could increase the degree of eutrophication.
Fig. 12 The presence of underwater plants in a) the Neajlov River, and the Danube River at b) Crivina and c) Ostrovul Corbului.
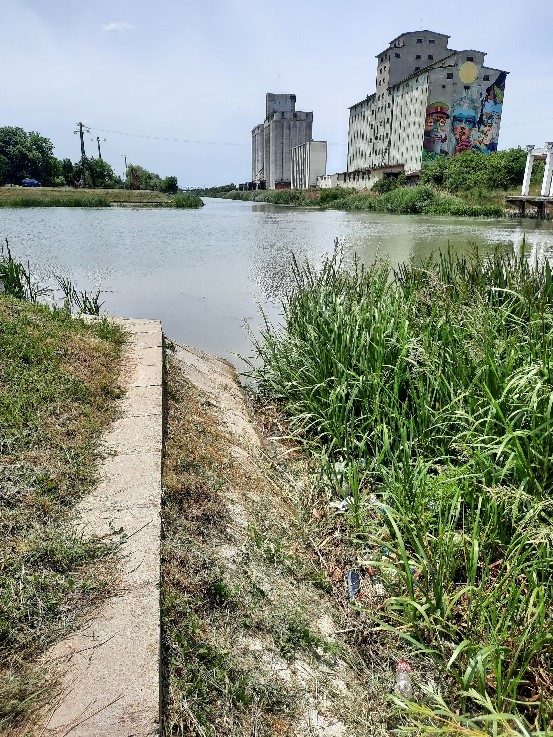
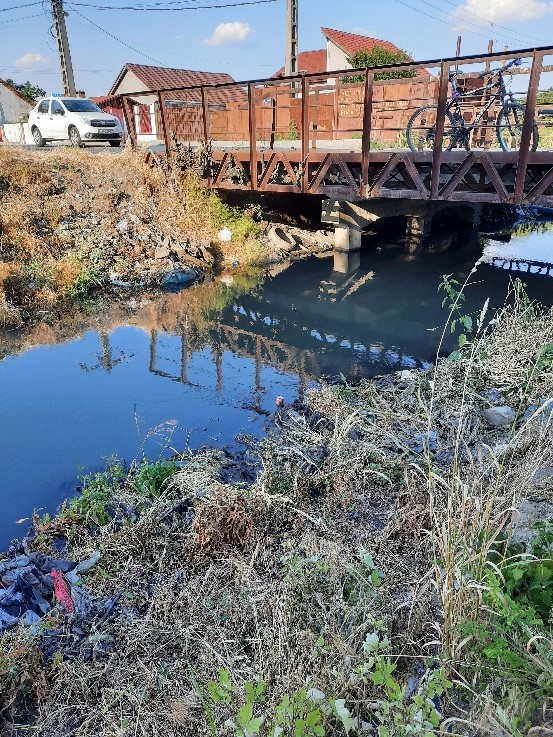
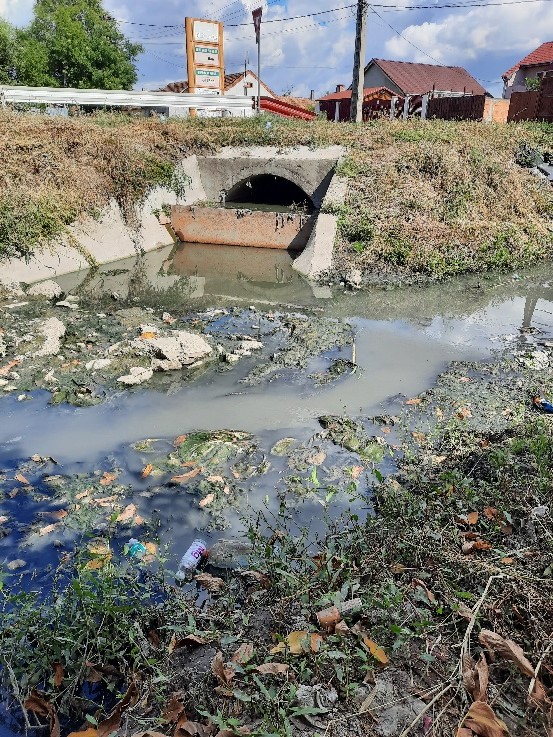
Regarding the sewage pollution, we have received photos for only one case where the pollution was considered extreme. The Mureșel Channel crosses the city of Arad, and on a portion of approximately 2 km, around the city center, it is canalized. In Figure 13a can be seen that the water of the Muresel Channel contains a large amount of suspended matter at the entrance in the city and presents a gray, non-transparent appearance. At the exit from the city, the color of the water becomes black (Fig. 13b), with a lot of waste on its banks and in the water. The 2 photos were taken on the same day, June 9, 2021. In September 2021, in the same place, at the exit of the city, it was observed that the water had a different color, light gray (Fig. 13c). In Figure 13c, a spillway could be observed, connecting to the Muresel Channel. There weren’t any official information about the sources of discharge and the degree of pollution, but the press and the online environment abounded with reports and images of water pollution in this channel. We have identified a press release, provided by SC Compania de Apă Arad SA in 201528, regarding the cessation of domestic water discharge into the Mureș river, where it was mentioned that water was going to be pumped from the Mureș River into the Mureșel Channel in order to dilute the water and eliminate household faecal waste water pollution.
Upon the analysis of the images provided by the participants, it was observed that Dâmbu and Telega Streams contain waters with a gray color, partially transparent, and a large load of dark gray sediments, without the presence of aquatic plants (Fig. 14). These aspects could indicate discharge of wastewater, however in a smaller amount than in the case of the Mureșel Channel. The Dâmbu Stream was polluted in the past with domestic wastewater from the urban areas it crosses and industrial waters from the refineries in the Ploiesti area29,30. No updated official information was found on Dâmbu and Telega Streams.
Fig. 13 Mureșel Channel at a) the entrance to the city of Arad (June 9, 2021), b) the exit from the city of Arad (June 9, 2021), c) the exit from the city of Arad (September 18, 2021).
Fig 14 Phots of streams polluted with wastewater from Prahova County: a) Dâmbu Stream, Ploiești (May 2, 2021); b) Telega Stream/Gârla Sărată, Scorțeni (May 3, 2021).
The non-transparent or partially transparent appearance of water has been observed in several aquatic systems. We evaluated the photographs submitted by the participants to determine the degree of transparency of the waters (Fig. 15). The assessment is obviously subjective because it depends on the resolution of the images, the position of the participant in relation to the surface of the water and the time of day. 10 points were removed from the analysis because the photos were taken at sunset or from a large distance. It was observed that in 23 points the water appeared completely opaque and in 31 points the water was partially transparent. Water transparency (turbidity) measures the depth of water penetration through the water column31. The lack of transparency can be caused by the high content of fine colloidal particles, organic substances, microorganisms or the presence of suspended magnesium and iron salts32. This parameter depends on numerous physical, chemical and biological factors, the natural geology of the system and the human footprint in the watershed. Some aquatic systems exhibit a high degree of turbidity naturally, and transparency naturally varies with rainfall, wind patterns, and the changing sunlight. However, human activities performed upstream of water systems can increase soil erosion and bring a significant input of nutrients and sediments that could increase the degree of turbidity in clear waters. Suspended particles absorb or scatter light, affecting the diversity and productivity of aquatic organisms31. Natural and anthropogenic activities bring a large amount of organic matter, particulate or dissolved, into aquatic systems. In the past, the role of dissolved organic matter in biogeochemical processes was underestimated. A single sample of dissolved organic matter may contain tens of thousands of molecules, each with different chemical properties and degree of reactivity in the environment. Anthropogenic activities can change the composition of dissolved organic matter in aquatic systems, thus modifying the impact of this matter on biogeochemical processes (microbial activity, primary production, carbon capture and emission, denitrification, etc). Factors such as drought, agricultural crops, eutrophication, climate change, fires, damming of water systems, floods, increased urbanization, alter the concentration, composition, cycle and bioavailability of dissolved organic matter. The effects of these changes are reflected in the attenuation of light entering the water, the alteration of primary production and the carbon cycle, and the increase of metal toxicity. In the long term, it affects ecosystem services by degrading water quality, limiting the supply of clean water and food, and losing recreational services33. The amount of organic matter can be estimated from the color and transparency of water. The darker the water, the more organic matter the water contains. Most of the aquatic systems assessed by the participants contain substantial amounts of organic matter and would require a complex assessment of the systems’ condition, correlated with the sources of pollution. But in order to effectively evaluate organic matter, natural or anthropogenic, laboratory analyzes of total organic carbon, fluorescence spectroscopy, UV-VIS absorption, chemical oxygen consumption, biological oxygen consumption are necessary.
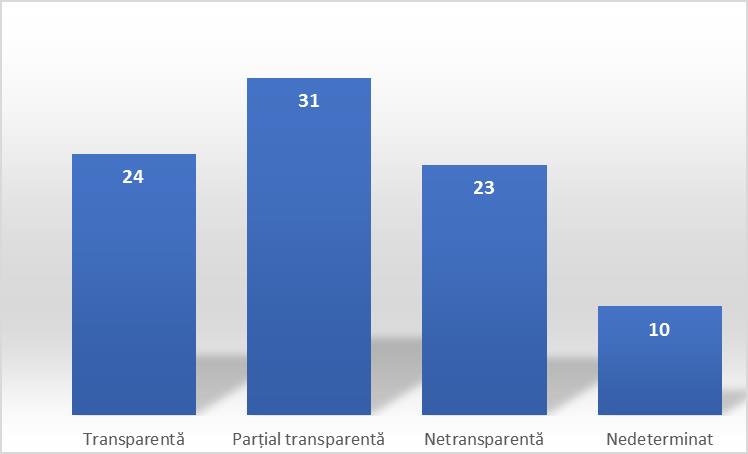
Fig 15 Assessment of water transparency using information provided by participants. The degree of transparency was assessed on records made at different locations and dates, so some aquatic systems are included in the analysis at least twice.
Based on the data sent by the participants, we can conclude that waste, especially plastic waste, is a prevalent problem for aquatic systems in Romania, which if not removed will accumulate and suffocate the entire system. Also, the Mureșel Channel presents excessive amounts of organic matter and requires urgent remediation actions. The discharge of excessive amounts of untreated wastewater into the channelrepresents a danger for the population in the area and affects the health of the Mureș River into which it flows. Also, the appearance of the Neajlov, Sabar, Strei and Ialomita Rivers indicated the presence of large amounts of organic matter and nutrients. Thus, detailed investigations are recommended in order to determine the state of ecosystems and to identify potential sources of pollution.
Rivers have the ability to transform organic matter into biomass, which can be used as an energy source in the food chain, and to reduce excessive nutrients and sediment by storing and mineralizing organic matter entering the system34. But increasing urbanization has led to changes in the geomorphological, hydrological and microbiological characteristics, reducing their capacity to retain and transform organic matter. Thus, rivers that cross urban areas accumulate a large amount of organic, bioavailable matter, which stimulates microbial activity and exacerbates eutrophication34. Although from the photos and information punctually provided by the participants, most of the evaluated aquatic systems appear clean, by analyzing the official quality studies of those waters and media information on accidental pollution, it was observed that only 21% are not threatened by various sources of pollution. Systems with a low degree of vulnerability are located in mountainous, rural, or sparsely populated areas (Fig. 16).
Obținerea unor imagini și date în mai multe puncte de-a lungul unui sistem acvatic ajută la vizualizarea amploarei vulnerabilității sistemelor. De exemplu, pe traseul râului Olt se pot observa cel puțin 5 puncte cu vulnerabilitatea mare (Fig. 16). Suprafața bazinului hidrografic al râului Olt este de 24.050 km2, primește 179 de afluenți și include 42 de orașe. În raportul Administrației Naționale Apele Române 35, s-au determinat trei surse de poluare difuză: zonele urbane, agricultura și industria. Zonele urbane deversează cantități mari de ape uzate (menajere și meteorice) în bazinul hidrografic Olt. Doar 59 de aglomerări urbane, din 297 (cu >2000 locuitori echivalenți), sunt dotate cu sisteme de canalizare și doar 29 dintre ele sunt conforme cu legile în vigoare cu privire la deversarea apelor uzate 35. În 2002, la nivelul bazinului hidrografic Olt, se foloseau în activitățile agricole în medie 12,1 kg N/ha și 4,56 kg P/ha de teren agricol. Deși cantitățile de îngrășăminte utilizate au scăzut în anii următori, activitățile agricole reprezintă în continuare o sursă principala de poluare difuză. La acestea se adaugă alte presiuni antropice precum îndiguire, prelevare apă, deversări industriale.
Obtaining images and data at multiple points throughout an aquatic system helps visualize the extent of systems vulnerability. For example, on the route of Olt River, could be observed at least 5 points with high vulnerability (Fig. 16). The area of the Olt river basin is 24,050 km2, it receives 179 tributaries and includes 42 cities. In the report of the Romanian Waters National Administration35, three sources of diffuse pollution were determined: urban areas, agriculture and industry. Urban areas discharge large amounts of wastewater (domestic and meteoric) into the Olt watershed. Only 59 urban agglomerations, out of 297 (with >2000 equivalent inhabitants), are equipped with sewage systems and only 29 of them comply with the laws regarding the discharge of waste water35. In 2002, in the case of Olt hydrographic basin, an average of 12.1 kg N/ha and 4.56 kg P/ha of agricultural land were used for various agricultural activities. Although the amounts of fertilizers used have decreased in recent years, agricultural activities are still a major source of diffused pollution. Other anthropogenic pressures such as damming, water abstraction, industrial discharges are added.
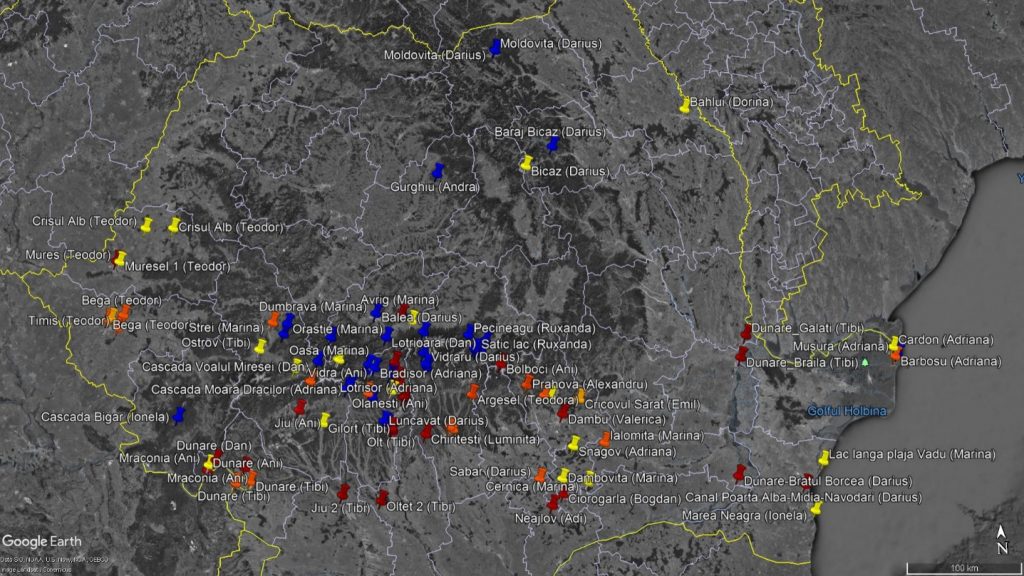
Fig. 16 Distribution of points for which participants submitted photos and data. The color codes indicate the degree of vulnerability of the analyzed aquatic systems: red – very high degree, orange – high degree, yellow – moderate degree, blue – minimum degree.
Limitations
A major limitation of the study was represented by the the low temporal and spatial resolutions. By continuously promoting the online platform Aqua S.O.S. and citizen science activities on social networks and in the media we are expecting to have a greater impact and an increase in the number of registrations per year. Another limitation is related to subjective assessment by both participants and research team members. Participants may give erroneous observations about aquatic systems, so photographs were requested to confirm the information. On the other hand, there is a possibility that participants will deliberately avoid photographing waste or unsightly areas. For example, one participant testified that she sought to photograph an area where waste was not visible. Subjective assessment by researchers refers to the interpretation of information about the aquatic systems in the absence of quantifiable data. However, monitoring with quantitative data at the national level, of all aquatic systems, is difficult to achieve, especially at high frequency. By involving the public, vulnerable areas can be identified and detailed investigations can be carried out.
It is also important to note that the information provided by the participants represents only one point in time. This fact can be observed for data and photos submitted by participants for the same aquatic system. For example, for the Olt River only two different participants photographed waste on the surface of the water. Seasonal variability, the occurrence of accidental pollutions that can be remedied from one assessment to another, as well as the geographical location are highly important.
Recruitment of volunteers
At this stage, we initiated the campaign to recruit volunteers for water quality monitoring. The announcement was posted on social networks (Facebook and Instagram), and some participants were contacted by email. The recruitment of volunteers from different regions of the country was considered. The desired target was 5 volunteers, but at the moment of this report, only 4 volunteers have responded to the invitation: 2 responded to the email request; 2 responded on facebook. Volunteers were allowed to choose the aquatic systems they wanted to monitor. According to Redmon et al. 36, “people care about what they know and use”. They demonstrated this fact through the campaign to monitor the content of lead in drinking water at childcare centers and kindergartens, where the interest in participation was high. Our volunteer recruitment campaign started from the same premises so that they would be motivated to participate in the project. Each of the volunteers received an educational backpack containing test kits for pH, conductivity, turbidity, total solids, nitrates and phosphates. Instructions and a monitoring schedule was also included. Volunteers were given the freedom to decide the measurement frequency (minimum seasonal frequency and maximum weekly) and which parameters they wanted to analyze.
In the next stage, a monitoring campaign was scheduled to be carried out, with a duration of 7 months, by involving volunteers in taking and measuring water samples. Social media mining analysis will also be completed. To date, a set of photos of aquatic systems in Romania has been collected using Instagram. But it is necessary to develop an algorithm and a protocol for collecting and processing images considering the large volume of images. Towards the end of the campaign, questionnaires will be sent to assess participants’ perceptions of citizen science programs.
Dissemination
- Published research article:
I.S. Donțu, C.L. Popa, E.M. Cârstea, D. Tenciu, Optoelectronic investigation for determination of plastics polymers behavior in surface water, Journal of Optoelectronics and Advanced Materials, 23(11-12), 2021, 624-629.
- Book chapter accepted for publication:
E.M. Cârstea, C.L. Popa, S.I. Donțu, Citizen science for the Danube River – knowledge transfer, challenges and perspectives, The Lower Danube River Hydro-environmental Issues and Sustainability, Ed. A. Negm, L. Zaharia, G.I. Toroimac, Springer Nature, 2021.
- Social media accounts:
Facebook – https://fb.me/ecomore.citizen.science;
Twitter – https://twitter.com/ECOMOREproject;
Instagram – @aqua.sos
- Web pages:
ecomore.inoe.ro;
aquasos.inoe.ro
- Media:
Radio România Cultural – Știința 360 și Născut în România;
TVR2 – E vremea ta!
Bibliography
1. Miller-Rushing, A., Primack, R. & Bonney, R. The history of public participation in ecological research. Front. Ecol. Environ. 10, 285–290 (2012).
2. Wildschut, D. & Zijp, H. The discoveries of citizens running around. Clim. Risk Manag. 28, 100225 (2020).
3. Conrad, C. C. & Hilchey, K. G. A review of citizen science and community-based environmental monitoring: Issues and opportunities. Environ. Monit. Assess. 176, 273–291 (2011).
4. Longo, A., Zappatore, M. & Bochicchio, M. A. Apollon: Towards a citizen science methodology for urban environmental monitoring. Futur. Gener. Comput. Syst. 112, 899–912 (2020).
5. Jollymore, A., Haines, M. J., Satterfield, T. & Johnson, M. S. Citizen science for water quality monitoring: Data implications of citizen perspectives. J. Environ. Manage. 200, 456–467 (2017).
6. Braz Sousa, L. et al. Citizen science and smartphone e-entomology enables low-cost upscaling of mosquito surveillance. Sci. Total Environ. 704, 135349 (2020).
7. Chiu, C. C., Liao, C. P., Kuo, T. C. & Huang, H. W. Using citizen science to investigate the spatial-temporal distribution of floating marine litter in the waters around Taiwan. Mar. Pollut. Bull. 157, 111301 (2020).
8. Freihardt, J. Can Citizen Science using social media inform sanitation planning? J. Environ. Manage. 259, 110053 (2020).
9. EurActiv. EurActiv. https://www.euractiv.ro/infosociety/aproape-zece-milioane-de-utilizatori-facebook-in-romania-13323 (2020).
10. Abrihann, R. Utilizarea smartphone-urilor in Romania a crescut de peste 4 ori in ultimii ani. Cum folosesc romanii telefoanele inteligente. Startup cafe https://www.startupcafe.ro/stiri-hitech-21640812-utilizarea-smartphone-urilor-romania-crescut-peste-4-ori-ultimii-ani-cum-folosesc-romanii-telefoanele-inteligente.htm (2017).
11. FreshWater Watch. FreshWater Watch, Earthwatch Europe. https://freshwaterwatch.thewaterhub.org/our-data/explore-our-data (2020).
12. EarthEcho. EarthEcho Water Challenge. https://www.monitorwater.org/ (2020).
13. Clean Danube. Pentru o Dunăre cu apele curate. http://www.dunarea-curata.ro/index.php (2020).
14. Carstea, E. M., Popa, C. L. & Dontu, S. I. Citizen Science for the Danube River – Knowledge Transfer, Challenges and Perspectives. in 35 (2021).
15. Kiessling, T. et al. Plastic Pirates sample litter at rivers in Germany – Riverside litter and litter sources estimated by schoolchildren. Environ. Pollut. 245, 545–557 (2019).
16. ECSA. Ten principles of citizen science. (2015).
17. Stefanski, R. How declining attention spans impact your social media. Muck Rack Blog https://muckrack.com/blog/2020/07/14/how-declining-attention-spans-impact-your-social-media (2020).
18. Weeser, B. et al. Citizen science pioneers in Kenya – A crowdsourced approach for hydrological monitoring. Sci. Total Environ. 631–632, 1590–1599 (2018).
19. Tian, X., ten Veldhuis, M., Schleiss, M., Bouwens, C. & van de Giesen, N. Critical rainfall thresholds for urban pluvial flooding inferred from citizen observations. Sci. Total Environ. 689, 258–268 (2019).
20. Fehri, R., Khlifi, S. & Vanclooster, M. Testing a citizen science water monitoring approach in Tunisia. Environ. Sci. Policy 104, 67–72 (2020).
21. 25 statistici privind social media in 2020. Business Days https://www.businessdays.ro/blog/tehnologie-inovatie/25-statistici-privind-social-media-in-2020 (2020).
22. Scott, A. B. & Frost, P. C. Monitoring water quality in Toronto’s urban stormwater ponds: Assessing participation rates and data quality of water sampling by citizen scientists in the FreshWater Watch. Sci. Total Environ. 592, 738–744 (2017).
23. van Emmerik, T. & Schwartz, A. Plastic debris in rivers. WIREs Water 7, e1398(1-24) (2020).
24. Winton, D. J., Anderson, L. G., Rocliffe, S. & Loiselle, S. Macroplastic pollution in freshwater environments: Focusing public and policy action. Sci. Total Environ. 704, 135242 (2020).
25. Demars, B. O. L. The aquatic macrophytes of an English lowland river system: Assessing response to nutrient enrichment. Hydrobiologia 384, 75–88 (1998).
26. Popa, C. L. et al. Spatial variation of organochlorine pesticides and dissolved organic matter in urban closed lakes. J. Environ. Sci. Heal. – Part B Pestic. Food Contam. Agric. Wastes 55, 329–341 (2020).
27. Popa, C. L. et al. Organochlorine pesticides and dissolved organic matter within a system of urban exorheic lakes. Environ. Monit. Assess. 192, 1–15 (2020).
28. SC Compania de Apa Arad. Comunicat de presa privind sistarea deversarii apelor provenite de la SP2 in raul Mures. 1 (2015).
29. Ministerul Mediului. Monitoring De Supraveghere. (2009).
30. ISU. Poluarea accidentala: Surse, puncte critice, cauze, masuri. (2010).
31. US Environmental Protection Agency. Indicators: water clarity. https://www.epa.gov/national-aquatic-resource-surveys/indicators-water-clarity.
32. Rusanescu, M. & Rusanescu, C. Analiza indicatorilor fizici ai unor ape din Romania. Proc. Int. Symp. SIMI 2011 “The Environ. Ind. 271–276 (2011).
33. Xenopoulos, M. A. et al. How humans alter dissolved organic matter composition in freshwater: relevance for the Earth’s biogeochemistry. Biogeochemistry 154, 323–348 (2021).
34. Kelso, J. E. & Baker, M. A. Organic Matter Is a Mixture of Terrestrial, Autochthonous, and Wastewater Effluent in an Urban River. Front. Environ. Sci. 7, 1–16 (2020).
35. ANAR. Planul de management al bazinului hidrografic Olt. (2020).
36. Redmon, J. H., Levine, K. E., Aceituno, A. M., Litzenberger, K. & Gibson, J. M. D. Lead in drinking water at North Carolina childcare centers: Piloting a citizen science-based testing strategy. Environ. Res. 183, 109126 (2020).
